For cat and analytics teams
An open alternative to your vendor models
Your analysts can run open catastrophe models as often as they need and compare them with the vendor models you already use.
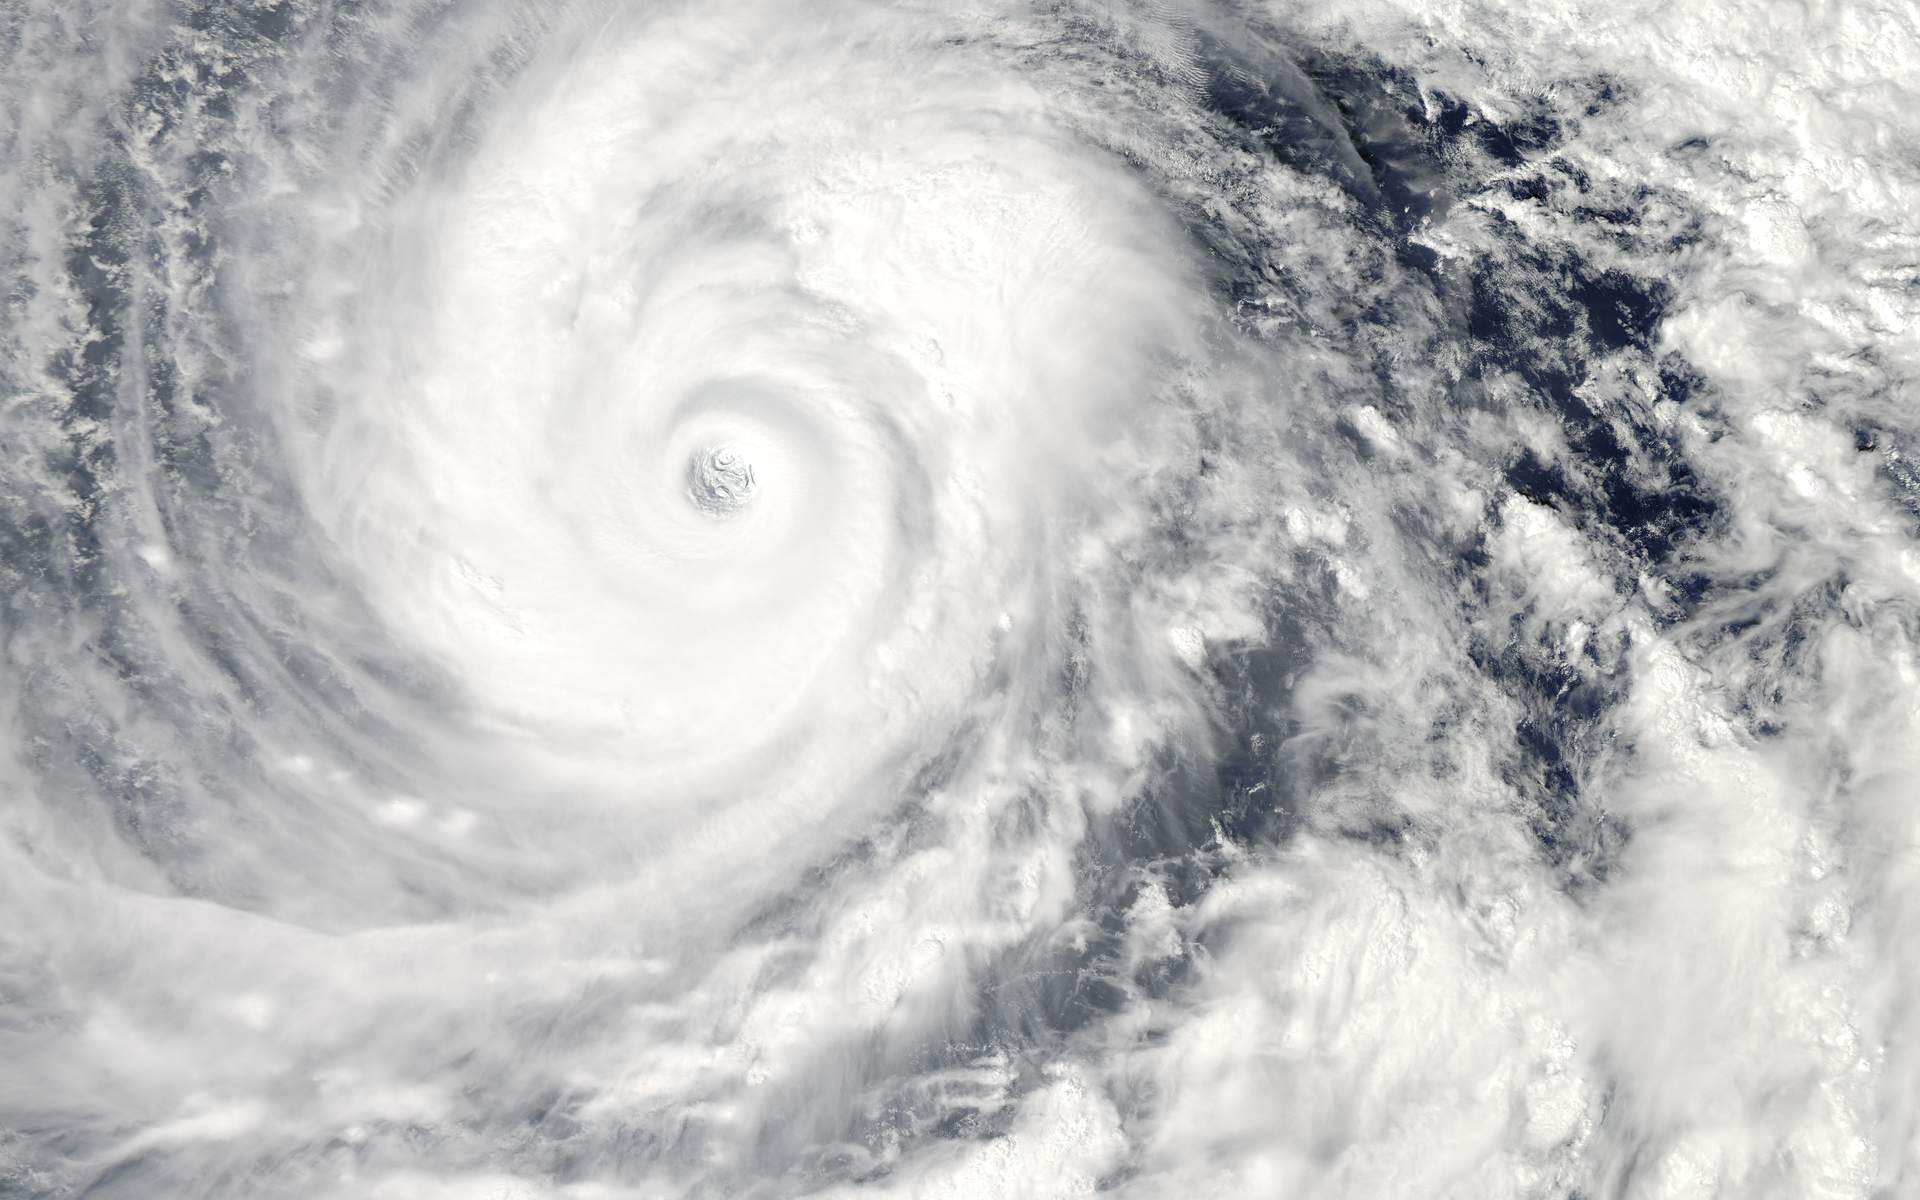
Image: Super Typhoon Vongfong, Philippine Sea, October 9, 2014. NASA, public domain.
Same storms, two published damage curves
10,000 simulated years
- LocationsMiami, Houston, New Orleans
- Emanuel (2011)$13,672 a year · 1-in-100 $369,776
- Eberenz et al. (2021)$6,664 a year · 1-in-100 $179,714
- Run idlab-climada-storm:df5dab0ff0f6c19a
How teams use it
How cat teams use Craton
-
Run the open models
Run CLIMADA, OpenQuake, Oasis, ESRM20 and the open flood and wildfire maps on your portfolio.
-
Compare results
See average annual loss, exceedance curves and return-period losses next to your vendor model’s results.
-
Build your own
Build a model from public data and run it through the API.
What you get
What is included
Nine open models
Hurricane, earthquake, flood, windstorm and wildfire models, each with its own documentation.
56 hazard datasets
Earthquake catalogs, storm tracks, weather records and other public hazard data.
Sensitivity ranges
Results include alternative damage curves and sampling ranges, so you can see how much the result varies.
Compare an open model with your vendor model
It is free to try, and a first run takes minutes.