For risk managers
Get a second opinion on your catastrophe numbers
Run open catastrophe models on your own locations before renewal, and compare the results with your broker’s figures.
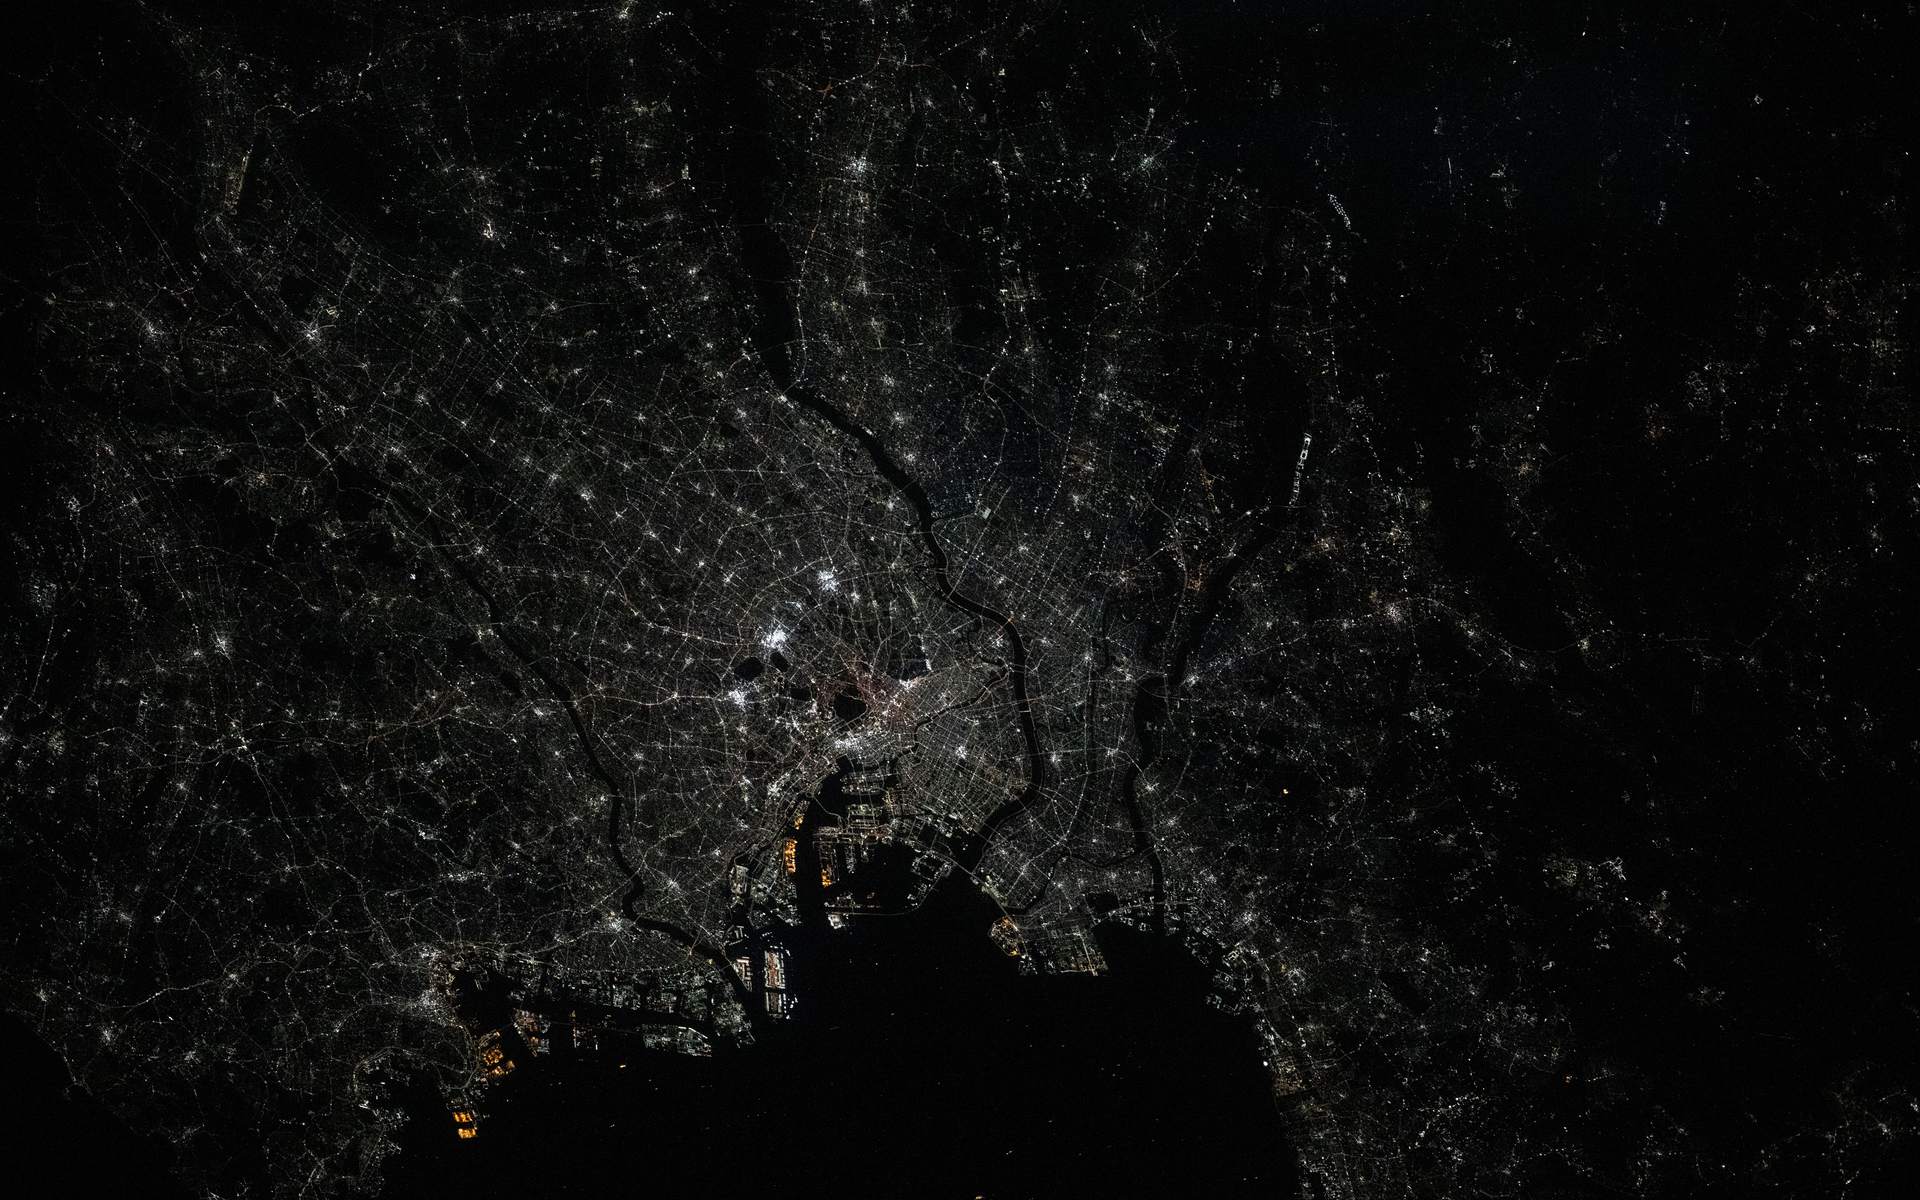
Image: Tokyo Bay at night from the ISS, August 26, 2025. NASA, public domain.
Example model run · Simulated hurricanes
Reproducible
- Run idlab-climada-storm:df5dab0ff0f6c19a
- ModelCLIMADA 6.1.0, STORM v4 tracks
- Years10,000 simulated
- LocationsMiami, Houston, New Orleans
- Average loss a year$13,672 on $10M
- 1-in-100 loss$369,776
How it works
How to get a second opinion
-
Upload your schedule
Use your schedule of values as it is. The SOV coder can add OED codes to messy rows.
-
Run the open models
Run hurricane, earthquake, flood and wildfire models on the same locations.
-
Compare
See average annual loss and 1-in-100 losses next to your broker’s figures.
Why it helps
What you get
The model and data behind each result
Every result shows the model and data behind it, so you can explain it to your board.
Reproducible results
Running the same inputs next year gives the same result, so if a number changes, you can see whether your locations, the data or the model version changed.
Run your first model
Try the nine open models for free. No card needed.